Time in the Market,
Not Timing the Market
START WITH YOUR LIFE, NOT A PRODUCT
The hardest trade may be the one you must make twice.
An owner sees alarming headlines and moves investments to cash. For a moment, the decision feels settled. Then markets rise before the news feels reassuring. Now there is a second decision: when to return.
This fictional story is why timing is more than predicting a decline. It requires an exit and a re-entry, with taxes, trading costs and missed opportunities along the way. Staying invested also involves real loss risk; patience is not a substitute for an appropriate allocation.
Think of an investment plan as a route chosen for a destination, not a demand to drive faster through every storm. Sometimes the route should change because your needs changed. That is different from repeatedly changing direction because the latest headline feels urgent.
Why planning is about funding life,
not winning every quarter.
Fund your life. An investment plan has a job: help pay for the life you want. That might mean more freedom after a business sale, retirement income, or support for your family. The scoreboard is not whether you beat a neighbor this quarter.
Give a suitable plan time. “Time in the market” means giving a suitable long-term plan time to work, rather than repeatedly moving in and out because of a forecast. It does not mean investing every dollar, ignoring risk, or holding a bad investment forever.
Match risk to the spending date. First ask when you will need the money. A near-term spending need and a goal decades away should not automatically carry the same risk. Your ability to absorb a loss matters as much as your willingness to take one. [1]
A good plan should fit your life before it tries to fit a market forecast.
Getting out is only
half the decision
Two decisions, not one. A market-timing plan must answer two questions: When do I sell? And when do I buy back? Being right about a scary headline is not enough. The price may already reflect the bad news, and a recovery may begin before the news feels reassuring.
What sitting out means. The simple example below is not market history. It shows the trade-off of sitting out: you avoid what happens next, whether that is a loss or a gain. Assume cash earns 0%, with no fees, taxes or cash flows.
Planning is not forecasting. Staying invested is not a promise of a rebound. A stock can fail, and a diversified portfolio can fall sharply. Changing an allocation because your spending needs or ability to bear risk changed is planning; changing it because you believe you know next month’s winner is a forecast. [1]
Write the rule for getting back in before you make a decision to get out.
Big up days can arrive
in a down market
Recoveries can surprise. In 2008, this broad U.S. stock-market measure lost 36.46%, yet gained 11.36% on October 13. Powerful up days can arrive before the news feels reassuring. [6]
What the illustration measures. Start with $10,000 in a broad U.S. stock-market research portfolio. Remove the best 10, 30 or 90 trading days across the full 20 years, identified after the fact, replacing their returns with 0%. These are not consecutive days or only days in rising markets. [6]
The other side of the test. This one-sided test does not prove timing always fails. Missing the worst 10 days leaves $196,334; missing both the best and worst 10 leaves $88,904. Those dates are unknowable in advance. [6]
A balanced plan is different. A diversified mix of dividend-paying stocks and high-quality bonds is a different portfolio, not this benchmark. Its purpose is income and growth with risk you can live with, not owning every winner. Results depend on holdings, weights, costs and rebalancing. Bonds can lose value; dividends can be cut. Diversification does not eliminate risk. [1]
The lesson is the risk of missing a recovery, not a promise that staying invested always wins.
Average returns are
not your ending balance
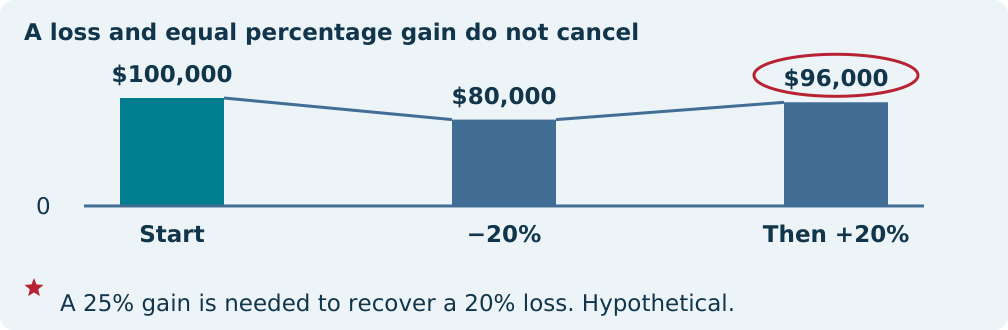
Averages can mislead. If an investment rises 20% and then falls 20%, the average of those two percentages is zero. But your money does not finish where it started. The loss applies to a larger balance.
Follow the dollars. The multiplication is simple: $100 × 1.20 × 0.80 = $96. Reverse the order and the ending value is still $96, as long as there are no deposits or withdrawals. Cash flows can make the order of returns matter to your outcome.
Recovery takes a larger gain. A loss also needs a larger percentage gain to recover. After a 20% loss, $100 becomes $80. It takes a 25% gain on $80 to return to $100. After a 50% loss, it takes a 100% gain. That is a reason to choose manageable risk, not proof that low-risk investments always win.
The goal is an appropriate level of risk, not the most exciting average return.
Allocation matters.
The “90%” needs context.
Know the difference. Asset allocation is how you divide money among types of investments. Diversification means spreading exposure rather than relying on one company, industry or market. Neither is insurance against a loss. [1]
What the study actually found. The often-quoted Brinson study found that policy allocation explained, on average, 93.6% of the variation over time in quarterly portfolio returns in its pension-fund sample. It did not say allocation produces 93.6% of your return dollars or a 93.6% chance of success. Later work explicitly separated these different questions. [2, 3]
About those monkeys. And the monkeys? Burton Malkiel’s dart-throwing monkey was a memorable metaphor in A Random Walk Down Wall Street, not a controlled scientific trial of monkeys beating experts. The later Wall Street Journal contest used staff-thrown darts and was informal. [4]
Keep the useful lesson. The useful lesson is humility about forecasts. You do not have to treat every stock tip as an essential ingredient in your plan. But a dartboard is not a substitute for diversification, reasonable costs or a suitable risk level.
Keep the lesson. Drop the inflated statistic and the monkey “study.”
Rebalance the risk.
Do not crown a winner.
Reset the risk. Rebalancing means bringing investments back toward an intended mix after markets move it away from the target. It can involve selling some of what rose and adding to what lagged, or directing new contributions to the underweight part. Its purpose is risk control, not a guaranteed return boost. [1]
Start with the same assumptions. Here is a deliberately contrived two-year example. Start with $100 split equally between A and B. In year 1, A gains 20% and B loses 10%. In year 2, those returns reverse. All three approaches finish year 1 with $105.
Compare the ending balances. For the rebalanced account, reset each holding to $52.50 after year 1. Year 2 ends at $47.25 + $63 = $110.25. Holding without a reset ends at $54 + $54 = $108. Moving all $105 into year 1’s winner ends at $94.50.
Know the limits. This example favors rebalancing because leadership reverses. In a persistent trend, holding the winner can do better. Real rebalancing can create transaction costs and taxes; decide on a review rule rather than copying this toy portfolio. [1]
A consistent process is different from consistent returns.
Your emotions invest
alongside you
Recognize fear and FOMO. When you are invested, a falling balance can make selling feel like relief. When you are out, a rising market can trigger fear of missing out, or FOMO. Neither feeling tells you whether today’s price is attractive or whether the risk fits your needs.
Name the bias. Loss aversion makes losses feel especially painful. Recency bias gives the latest trend too much weight. Overconfidence can turn a lucky call into a belief that the next turn is predictable. Together, these habits can pull an investor toward selling after declines and chasing after gains. [8]
Write rules in advance. Write rules before emotions are loud: define the money’s purpose, intended mix, rebalancing trigger and reasons to review. Before a major change, ask whether your life changed or only the headlines did. If you leave an investment, record the conditions for returning.
Pause, then decide. The goal is not to feel nothing. It is to slow the decision down enough to separate a real planning need from a reaction. Review the plan on a schedule and when circumstances change, rather than treating every market move as a new instruction.
Fear and FOMO are signals to review the plan, not automatic orders to trade.
Let time work.
Keep the plan honest.
Compounding in dollars. Compounding means gains can earn further gains. If $10,000 grew at a constant 6% a year for 20 years, it would become about $32,071. At a constant 5%, it would become about $26,533. The difference is about $5,538.
Costs and uncertainty matter. This is a simplified one-percentage-point annual return-drag illustration, not a fee quote or forecast. It assumes no cash flows, taxes or inflation; actual fees may be charged differently. Real returns are uneven and can be negative. Time creates opportunity for compounding, not certainty. Costs still matter because money spent on fees cannot stay invested. [5]
Put the plan in writing. A useful written plan answers four questions: What is the money for? When will I need it? How much loss could I absorb without disrupting those needs? What would justify changing the plan?
Review when life changes. Review those answers when life changes. Check the investment mix and total costs on a schedule. A frightening quarter deserves attention, but not an automatic rewrite. The objective is a plan you can sustain through uncertainty, not a promise that every year will be positive.
Bring your spending timeline, risk questions and rebalancing rule to a qualified advisor.
The value can be
helping you stay the course
Advice connects money to life. An advisor’s most valuable contribution may be helping you follow a suitable plan when fear says sell or excitement says take more risk than your life can support.
Understand the estimate. Vanguard’s Advisor’s Alpha research estimates potential value of about three percentage points in net returns over an unspecified period. This is not a promised annual gain, a guaranteed 3% or 4% bonus, or market-beating alpha. [7]
Behavior has the greatest potential. Behavioral coaching has the greatest potential contribution. Its value may be concentrated in a few difficult decisions, not delivered evenly each year. The framework also includes allocation, costs, rebalancing, tax-aware positioning and withdrawals. [7]
Value is personal. The comparison is with portfolios not using these practices, not a universal advisor-versus-DIY scorecard. Value depends on the investor, services and costs. A disciplined investor may already do some of this well. The test is whether advice connects money to life and improves decisions.
Good advice should help you make better decisions, not promise you a better market.
Sources and assumptions
- SEC Investor.gov. Asset Allocation. Risk tolerance, time horizon, diversification and rebalancing.
- Brinson, Hood and Beebower (1986). Determinants of Portfolio Performance; context from CFA Institute. Financial Analysts Journal 42(4), 39–44; 91 U.S. pension funds, 1974–1983. Variation over time is not return dollars.
- Ibbotson and Kaplan (2000). Does Asset Allocation Policy Explain 40, 90, or 100 Percent of Performance?. Financial Analysts Journal 56(1), 26–33. Different questions about performance produce different percentages.
- The Daily Princetonian (2002). Fourteen years of darts on Wall Street lead Malkiel to reassert stock theory. Direct comments from Malkiel and the contest reporter; not a scientific experiment.
- SEC Investor.gov (2025). Investor Bulletin: How Fees and Expenses Affect Your Investment Portfolio. Costs reduce the amount of money left invested. Our numerical example is independent and hypothetical.
- Kenneth R. French Data Library. Daily U.S. research factors and methodology. Author calculations from daily market total returns (Mkt-RF + RF), January 3, 2006–December 31, 2025; 5,031 trading days. Best/worst days ranked retrospectively; removed returns replaced by zero. August 2026 CRSP vintage, accessed October 23, 2026; inputs rounded to 0.01 percentage points. Research benchmark, not directly investable.
- Vanguard (2025). Celebrating Vanguard Advisor’s Alpha. Pages 3–4: estimated value over an unspecified period, not guaranteed annual alpha. Behavioral coaching has the greatest potential contribution; practices and client circumstances matter.
- CFA Institute (2026 curriculum). The Behavioral Biases of Individuals. Behavioral biases and investment decisions.
All diagrams are original explanatory artwork. Except for the explicitly labeled historical U.S. stock-market illustration, dollar examples are constructed arithmetic, not backtests or forecasts. There are no deposits or withdrawals unless explicitly stated. No probability of success is implied.
Bring the whole picture into focus
Use the Retirement X-Ray as an educational starting point. Then request a comprehensive review with a qualified financial advisor to discuss the life your money must fund, the risk you can afford and the rules you can follow. Tax and legal questions need the appropriate professionals.
Start with your Retirement X-RayThe original workbook’s historical illustration
The 28-page workbook, pages 4 and 26, reproduces Hartford Funds’ 1996–2025 illustration. It starts with $10,000 and compares full investment with hindsight removal of selected best days. This is a different period and source from the 2006–2025 research example elsewhere in this article; the two datasets must not be combined.
| Hartford 1996–2025 illustration | Ending amount | Difference from full investment |
|---|---|---|
| Fully invested | $192,167 | — |
| 10 best days omitted | $85,490 | −$106,677 |
| 30 best days omitted | $31,123 | −$161,044 |
How to read it: $192,167 − $85,490 = $106,677. That endpoint difference illustrates the importance of a small set of days in this particular history. It is not a predicted cost of a real market-timing rule, and it does not show what happens when the worst days are also avoided.
In the cited source, 48% of the 50 best days fell during bear markets and another 28% during the first two months of bull markets: 24 + 14 = 38 of 50 days, or 76%. Those classifications use hindsight. They show why a rebound can occur while conditions still feel uncomfortable, not how to know the next best day in advance.
Source: Hartford Funds, Timing the Market Is Impossible, data dated March 2026, as cited in the original workbook. Index illustrations are not an investable product or a guarantee; taxes, costs and methodology must be considered.
A CLOSER LOOK
What has to happen after getting out?
Selling during uncertainty may feel like completing a decision. For money intended to remain invested, it also creates a second decision: when and how to return. A plan needs a re-entry rule, a tax review and a clear purpose for the cash, not just a convincing reason to exit.
★ Circle 25%: the recovery percentage uses the smaller $80,000 base. This arithmetic explains why losses matter; it does not prove when to buy or sell. A market can fall further before recovering, and some investments never recover.
The coordination gap
The owner sells a taxable holding to feel safer; the accountant later identifies a gain and tax payment; another account is still exposed to the same risk. A coordinated review would compare the household's total exposure, cash needs and tax consequences before action.
Questions worth bringing to your professionals
- Is this a cash-need decision, a risk decision, or a market prediction?
- What written condition would trigger re-entry?
- How would taxes, fees and a delayed recovery affect the plan?
Hypothetical example without taxes, fees or withdrawals. Staying invested does not prevent losses. Diversification does not guarantee profit, and a suitable investment plan may change when circumstances change.
What a thoughtful review could help you do
- Recognize the two decisions hidden inside a market-timing move.
- Distinguish a necessary plan change from a reaction to noise.
- Discuss a repeatable rebalancing approach before emotions take over.
A practical next step
Ask which life changes would justify revisiting your allocation and how rebalancing decisions are made. Write down that process while markets are not making the decision feel urgent.
These are planning opportunities, not promised outcomes.
Educational and illustrative purposes only
This article is not tax, legal or investment advice and is not a recommendation to buy, sell or hold any investment or insurance product. Examples are hypothetical unless identified otherwise and do not guarantee future results. Before making decisions, speak with your qualified financial advisor, tax professional and legal professional, as appropriate, about your circumstances.