When Bad Years Arrive Early
Same returns. A very different retirement.
Two retirees start with $1,000,000 and receive the same 20 annual returns. Both withdraw $50,000 at the beginning of year 1 and increase that scheduled dollar amount by 2% each year. Only the order of returns changes.
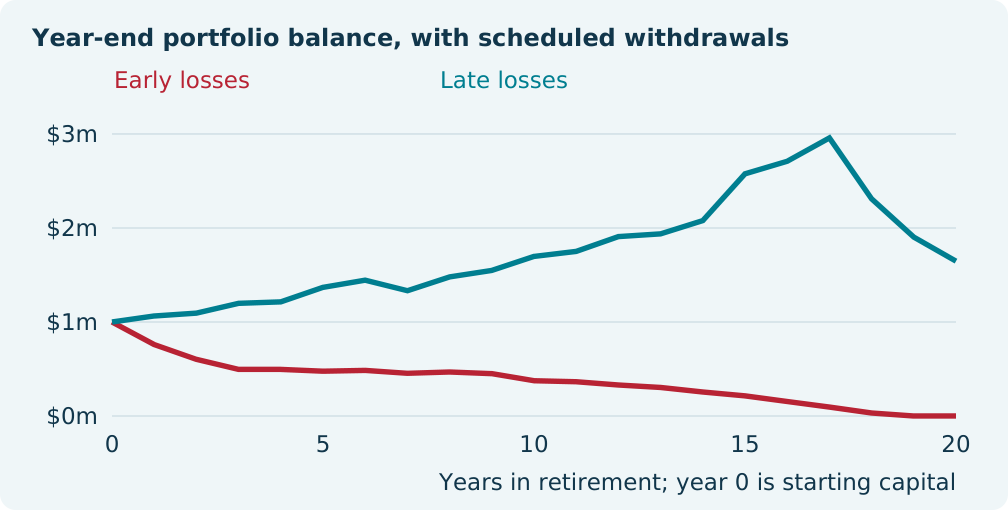
A withdrawal during a downturn removes dollars that cannot participate in a later recovery. With no cash flows, rearranging these returns changes the path but not the ending balance. With withdrawals, the order can change whether the spending plan is funded.
Constructed scenario, not historical performance, a random simulation or a four-bucket backtest. Returns are deliberately selected and treated as total portfolio returns. No fees, taxes, contributions, annuity returns or separate dividends are included. Balances cannot fall below zero. Calculations retain full precision and round only for display.
Follow the dollars: years 1-10
| Year | Scheduled draw | Early return | Early-loss balance | Late return | Late-loss balance |
|---|---|---|---|---|---|
| 1 | $50,000 | -20% | $760,000 | +12% | $1,064,000 |
| 2 | $51,000 | -15% | $602,650 | +8% | $1,094,040 |
| 3 | $52,020 | -10% | $495,567 | +15% | $1,198,323 |
| 4 | $53,060 | +12% | $495,607 | +6% | $1,213,978 |
| 5 | $54,122 | +8% | $476,805 | +18% | $1,368,631 |
| 6 | $55,204 | +15% | $484,841 | +10% | $1,444,770 |
| 7 | $56,308 | +6% | $454,245 | -4% | $1,332,923 |
| 8 | $57,434 | +18% | $468,236 | +16% | $1,479,567 |
| 9 | $58,583 | +10% | $450,618 | +9% | $1,548,873 |
| 10 | $59,755 | -4% | $375,229 | +14% | $1,697,594 |
Follow the dollars: years 11-20
| Year | Scheduled draw | Early return | Early-loss balance | Late return | Late-loss balance |
|---|---|---|---|---|---|
| 11 | $60,950 | +16% | $364,564 | +7% | $1,751,210 |
| 12 | $62,169 | +9% | $329,611 | +13% | $1,908,616 |
| 13 | $63,412 | +14% | $303,467 | +5% | $1,937,465 |
| 14 | $64,680 | +7% | $255,502 | +11% | $2,078,791 |
| 15 | $65,974 | +13% | $214,166 | +28% | $2,576,405 |
| 16 | $67,293 | +5% | $154,217 | +8% | $2,709,841 |
| 17 | $68,639 | +11% | $94,991 | +12% | $2,958,146 |
| 18 | $70,012 | +28% | $31,973 | -20% | $2,310,507 |
| 19 | $71,412 | +8% | $0 | -15% | $1,903,230 |
| 20 | $72,841 | +12% | $0 | -10% | $1,647,351 |
Make every step auditable
1. Set the scheduled withdrawal
Year t scheduled draw = $50,000 x 1.02^(t - 1). The withdrawal happens before that year’s return, not after it.
2. Limit the payment to available money
Actual draw = the smaller of the scheduled draw and the beginning balance. Unmet draw = scheduled draw minus actual draw.
3. Apply the return to what remains
Ending balance = (beginning balance - actual draw) x (1 + annual return). The ending balance becomes next year’s beginning balance. Once depleted, the account stays at zero.
4. Check the first two years
Early losses: ($1,000,000 - $50,000) x 0.80 = $760,000. Then ($760,000 - $51,000) x 0.85 = $602,650. Late losses: ($1,000,000 - $50,000) x 1.12 = $1,064,000. Then ($1,064,000 - $51,000) x 1.08 = $1,094,040.
A shortfall is not a negative balance
The early-loss path begins year 19 with $31,972.72. Against the scheduled $71,412.31 draw, it pays $31,972.72 and leaves $39,439.60 unmet. Year 20 pays $0 against $72,840.56 scheduled. Combined unmet withdrawals are $112,280.15, or $112,280 rounded once from full precision. Adding the separately rounded cents produces a one-cent rounding difference.
Same averages. Different cash-flow outcomes.
Both return orders have a 7.15% arithmetic average: the 20 percentage returns sum to 143%, divided by 20. Their no-withdrawal compound annual return is 6.519206%, or 6.52%: multiply all 20 (1 + return) factors, take the twentieth root, then subtract 1. Starting with $1,000,000 and taking no withdrawals, both finish at $3,536,376. Neither average describes the return on a retirement spending plan.
What if the initial draw is $40,000?
Change only the initial scheduled draw to $40,000, still rising 2% annually and paid before returns. Neither path depletes within these 20 years: early losses leave $603,845 and late losses leave $2,025,156. That is a sensitivity test, not proof that a 4% starting draw is universally safe.
Plan for the order, too
Know the spending gap
Separate essential expenses from flexible spending and subtract reliable income. The amount the portfolio must supply is a key part of sequence risk.
Discuss a reserve and a refill rule
A reserve may reduce the need to sell volatile assets after losses, but it has an opportunity cost. Decide what replenishes it and when. This illustration does not test a reserve strategy.
Test allocation and spending together
Lower volatility, lower withdrawals and flexible spending can change outcomes, with trade-offs. Bucket labels alone do not prevent depletion; holdings, fees and withdrawal rules do the work.
Source and reproducibility
Original scenario: How Smart Investors Prepare for the Storm, pages 10-11 (return paths and displayed table) and page 26 (calculation methods), reviewed November 10, 2026. All 40 annual return entries are preserved here. This standalone edition independently recalculates the results; the source is an illustration, not market evidence.
Charles Schwab: What Is Sequence-of-Returns Risk? Conceptual background only; returns here are independently constructed.