Is Your “Safe” Money Keeping Up With Your Life?

START WITH YOUR LIFE, NOT A PRODUCT
A higher balance is not always a bigger lifestyle.
A retired owner sees interest appear on a CD statement and feels relief: the dollar balance is growing. At the grocery store and pharmacy, however, the same monthly budget buys less. Both observations can be true.
The comparison is not about declaring CDs good or bad. A CD may serve a useful short-term purpose within its terms and insurance limits. The question is whether that same tool can do every job in a retirement plan, including keeping up with a changing cost of living.
Think of your balance as the number on a fuel gauge and purchasing power as the miles it will take you. The gauge alone does not tell the whole story. The historical table and worked example below show why rate definitions and spending assumptions must be visible.
A CD can protect dollars for a planned expense. Protecting what those dollars can buy is a different question.
First, compare the right CD rates
Yes, one-year CD offers exceeded 5% during parts of 2023 and 2024. RateBrain’s tracked offers reached 5.76% APY in 2023, and its monthly median reached 5.05% in June 2024. The original table used FDIC national averages, which are much lower than many competitive offers. Presenting those alone did not show the full picture.
The revised table shows both: the annual average of RateBrain’s monthly median one-year CD quotes, and the FDIC national benchmark. The tracked sample is not every bank, the best available rate, or an Edward Jones brokered-CD series. An annual average will also be lower than a brief peak. See the dated rate history.
Ten completed years, side by side
These are quote benchmarks and price changes, not returns earned by an actual investor. The bold final column uses the tracked CD column, before taxes, fees or penalties. Negative results are red and carry a minus sign.
| Year | Tracked CD quotes¹ | FDIC national CD² | Overall CPI | Groceries | Medical care | Fuel oil & other fuels | Custom inflation blend³ | CD after custom inflation⁴ |
|---|---|---|---|---|---|---|---|---|
| 2016 | 0.96% | 0.22% | 2.07% | −2.03% | 4.07% | 7.91% | 3.01% | −1.99% |
| 2017 | 1.11% | 0.26% | 2.11% | 0.89% | 1.78% | 12.61% | 4.35% | −3.10% |
| 2018 | 1.75% | 0.41% | 1.91% | 0.59% | 2.01% | 1.33% | 1.46% | 0.29% |
| 2019 | 2.19% | 0.59% | 2.29% | 0.73% | 4.57% | 2.24% | 2.46% | −0.26% |
| 2020 | 0.85% | 0.28% | 1.36% | 3.93% | 1.78% | −13.28% | −1.55% | 2.44% |
| 2021 | 0.40% | 0.14% | 7.04% | 6.49% | 2.17% | 37.98% | 13.42% | −11.48% |
| 2022 | 0.95% | 0.42% | 6.45% | 11.79% | 3.96% | 25.99% | 12.05% | −9.90% |
| 2023 | 4.61% | 1.64% | 3.35% | 1.31% | 0.45% | −11.81% | −1.68% | 6.39% |
| 2024 | 4.80% | 1.84% | 2.89% | 1.77% | 2.84% | −6.05% | 0.36% | 4.42% |
| 2025 | 4.23% | 1.72% | 2.68% | 2.36% | 3.15% | 1.25% | 2.36% | 1.82% |
It is the simple average of the four price-change columns: overall CPI, groceries, medical care, and fuel oil & other fuels. Each gets 25% weight. This is an illustrative, unweighted comparison requested for this article, not “true inflation,” an official index, or your household’s cost of living.
Overall CPI already includes these categories, so this blend counts their influence more than once. It also gives a small, volatile fuel category an unusually large role. Falling fuel prices can pull the blend below zero even when other costs rise. It is a different weighting choice, not a replacement for the published CPI.
The tracked-rate benchmark falls below this custom blend in 5 of 10 years, not all ten. Positive years matter too. The result changes with the CD rate, inflation measure and timing chosen; it does not establish that every CD lost purchasing power.
What these costs represent
Groceries means food at home. Medical care is a consumer price index, not a forecast of your premiums or lifetime care costs. Fuel oil & other fuels is a household-fuel category, not crude oil or gasoline. All four are U.S. city-average CPI-U series. Personal inflation depends on a household’s actual spending weights. Read the BLS explanation.
Give cash a job, not the whole retirement
CDs can serve near-term spending and the stable portion of a retirement plan. They are not, by themselves, a complete plan for decades of spending. Future renewal rates, taxes, liquidity and inflation all deserve attention. Eligible deposits have FDIC protection within applicable limits; that insurance does not protect purchasing power. A brokered CD sold before maturity may lose value. Investor.gov explains CD features and risks.
A useful professional conversation starts with when the money is needed and how cash, income and long-term investments fit together. This article does not recommend replacing a CD or buying any particular investment.
Sources and calculation notes
- Tracked quotes: RateBrain’s dated monthly median one-year CD APYs, averaged equally across twelve months in each year. This is an average of medians, not a national average; the tracked product count and providers change. No brokered-CD history is inferred.
- National benchmark: FDIC via FRED CD12NRNJ through March 2021 and NDR12MCD thereafter. Weekly observations are first averaged within each month, then months equally within each year. The FDIC methodology changed in April 2021, so this secondary column bridges survey definitions.
- Price changes: December-to-December, using BLS/FRED all items, food at home, medical care, and fuel oil & other fuels. Custom blend = their arithmetic mean. Calculations use unrounded data; display uses two decimals.
- Inflation-adjusted proxy: [(1 + tracked CD rate/100) ÷ (1 + custom blend/100) − 1] × 100. This is more precise than simply subtracting percentages. Quoted rates are averaged across a calendar year while prices change from the previous December to that December. It is not a matched purchase-to-maturity CD backtest or an actual realized return. Taxes, fees and penalties are excluded.
Rechecked November 10, 2026. 2026 is excluded because it is incomplete. Educational illustration only; no guarantee of returns or protection against inflation.
A CLOSER LOOK
What does the percentage buy?
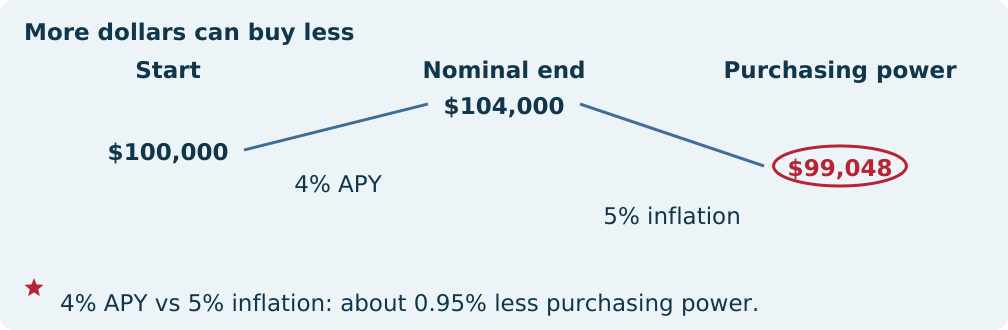
A CD statement measures dollars. A retirement budget measures what those dollars can purchase. Those two views can move in different directions, which is why a rate comparison needs both a time period and a spending assumption.
★ Circle the last number: the balance rose by $4,000, yet purchasing power fell about $952 before tax. $104,000 ÷ 1.05 = $99,048. The real change is about −0.95%, not a guaranteed outcome.
The coordination gap
The accountant forecasts a tax bill; the bank places cash into a longer CD; the owner needs the money early. No investment failed, but the timing did. A shared cash calendar can expose this mismatch before a deposit is locked up.
Questions worth bringing to your professionals
- When will each dollar be needed?
- Are the comparison rates available for the same maturity and deposit size?
- What happens after tax, at maturity, or if cash is needed early?
Hypothetical arithmetic only. Actual APYs, inflation, taxes and early-withdrawal terms vary. The custom blend in the historical table is an unweighted illustration, not personal or official inflation; it overlaps headline CPI categories.
What a thoughtful review could help you do
- Distinguish a quoted yield from a national deposit average.
- See why purchasing power and dollars can move in opposite directions.
- Match a cash tool to its intended time horizon instead of expecting one product to solve every need.
A practical next step
Bring your maturity dates, actual APYs and upcoming cash needs to a review. Compare returns after relevant taxes and a clearly defined spending measure, not an unlabeled “real inflation” claim.
These are planning opportunities, not promised outcomes.